LAB 5.3: Global Solar Power Suitability
[ 5.1,
5.2,
5.3,
5.4]
Assigned:
Due:
Purpose
You have compiled four data layers which will now be used to map areas around the world that are suitable for Solar Power. This project lacks a consideration of socioeconomic factors, this is perhaps one of the more important considerations but the data necessary to address this are local scale. The analysis we are going to perform will serve to identify regions that are suitable for considering for further investigation at a more local level.
I hope that you feel confident with your understanding of how each data layer was created. The basic raster GIS techniques you have learned can be adapted for other spatial questions but with each question comes a unique set of problems. You now know how to solve a few of the data related problems. In this lab we are going to use GIS to perform analysis which poses a whole new set of problems. The biggest problem is scale.
* Please take a few minutes to finalize all your maps, TOA, Cloudiness (mean and median, classified), Elevation and Population. Once you are content with your final maps, and exported the final version, proceed with the lab. We are going to clean-up everything before we do the analysis and generate the final maps of Solar Power Suitability. Be sure to close ArcMap when you are done finalizing your maps.
Step 1 - Get organized with ArcCatalog
As you have no doubt learned in the past weeks spent making data it is crucial to stay organized. The easiest strategy when working on a project like this where you have multiple data sources, different layers, and all kinds of different processing steps, is to divide and conquer: make folders, use consistent names, and clean-up as you go. You've kept folders for the different data layers, exported the final products to a master data directory (lab5_data), and you've used WinZip to archive old stuff just in case you need to go back to it.
ArcGIS provides several capable methods of keeping track of your data, one you have already learned about is ArcCatalog. Another way to stay organized is by using a Geodatabase. This is a new data structure introduced by ESRI. Although you can open a Geodatabase in Access, manipulating geospatial data is purely a function of ArcGIS.
If you are interested in Geodatabase capabilities, take a look at the material covered in this lab:
Geodatabase design & population
http://www.geog.ucsb.edu/%7Eta176/g176b/lab3/lab3.html
The capabilities of geodatabase as a means of creating, organizing and updating geospatial information are impressive but also complicated. All I would like you to do today is create a Geodatabase that will store your grid layers so you can see how it works.
Step 1.1 - Look at lab5_data with ArcCatalog
Start ArcCatalog, connect to the lab5_data folder. This folder should be relatively organized and only contain the final versions of your grids; 1) the grid representing incoming solar radiation (toa), 2) the grid representing the percentage of cloud free days per year (cloud_mean and cloud_med), 3) global topography (elevation), and 4) population density for 2015 (pop2015).
* Right-click on each of the grids in the left frame of the ArcCatalog Window and choose Build Pyramids, and then right-click again and choose Calculate Statistics. You will have to repeat this procedure after you modify these grids (i.e. after you project them).After you have created both the pyramid layer file and the statistics file for each grid. Look at the Metadata, click on the Spatial tab to look at the projection related information. All of your data accept the TOA grid are projected in degrees. The TOA grid is projected with planar meter units. We need to change the projection of the other grids to match this one.
If you properly exported each of your final grids you assigned a ccordinate system (WGS 1984, decimal degrees). All but the first one we made are in degrees, we need them to all be in projected planar units like the toa grid (equidistant, meters).
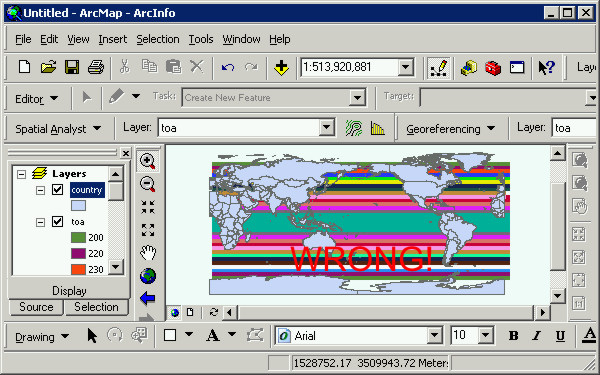
* Check the toa grid to make sure it is correct. Remember this dataset had the central meridian set to 180 (instead of 0, the Prime Meridian). If you did not change this before you exported the final toa grid you need to do this now. Open an empty ArcMap layout, add the toa grid first from lab5_data, then add the county dataset after you've added the toa grid. The county boundaries dataset can be found here: C:\program files\arcgis\bin\templatedata\world\
If the country dataset is "project on the fly" because it does not match the toa grid's projection you have a problem (see below).
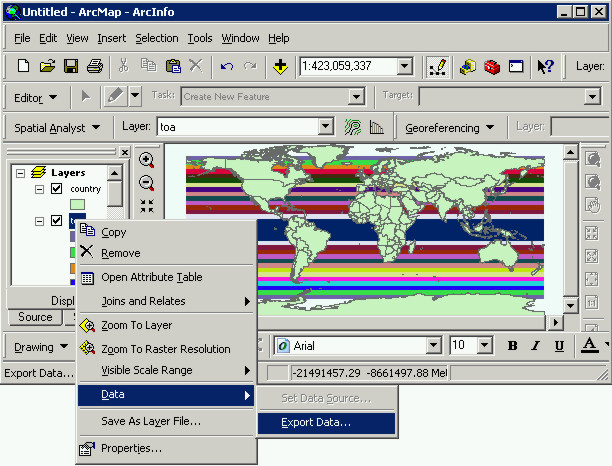
To fix this go to View -> Data Frame Properties, click the Modify button under Coordinate Systems tab. Change the projection so the central meridian is 0 (not 180), click Apply and OK. Then after it is right (see below), right-click on toa and do Data -> Export Data, and set the Spatial Reference to Data Frame (Current).
Start an empty ArcMap layout and add the new toa grid again, and then add the countries shapefile to check that that the central meridian is set at 0 (you can also check Properties -> Source). If its all good you're ready to reproject all the grids to match toa.
To reproject a raster start Toolbox and go to Data Management Tools -> Projections and Transformations -> Project Raster.
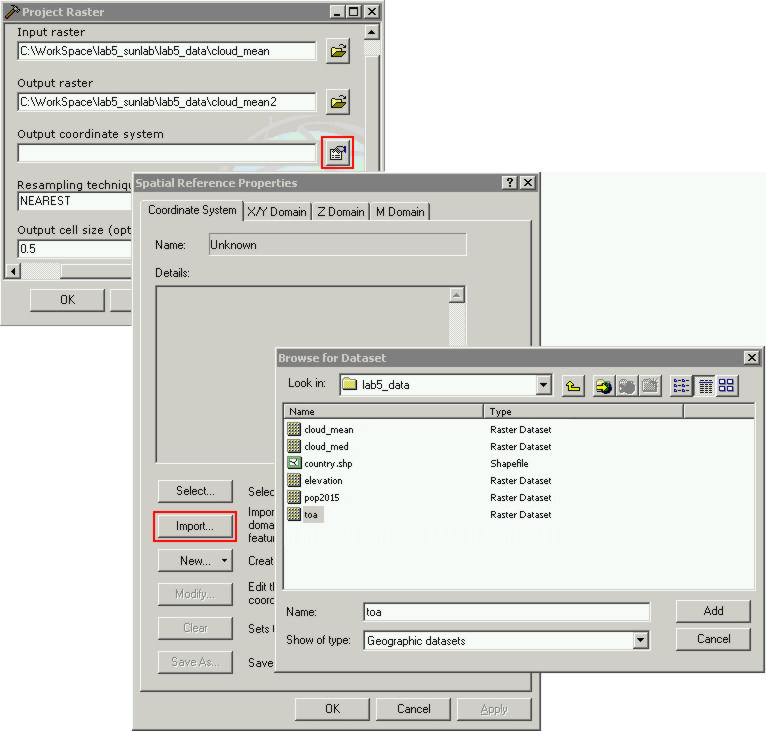
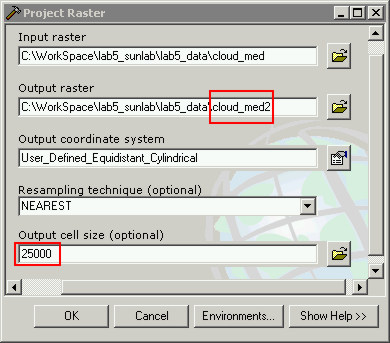
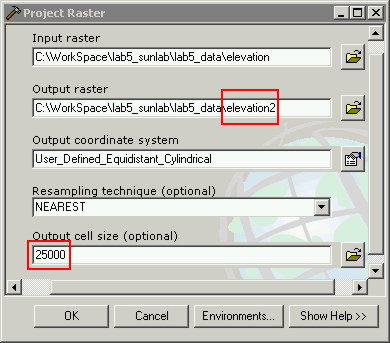
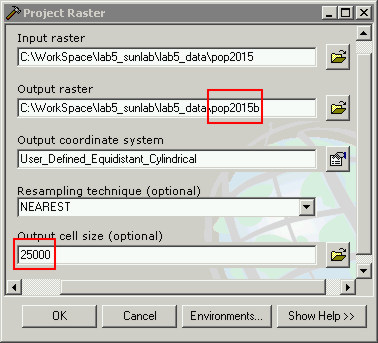
In the Project raster dialog select the first grid to reproject (clouds_mean) as the Input raster, name the output raster with "2" or "b" or something on the end of the name (cloud_mean2). To reproject a grid to match the projection of another grid, click the button next to the Output coordinate system field.
In the Spatial Reference Properties dialog click the Import button, then select the grid we want to use as the reference (toa) and click Add. Then click Apply to close the Spatial Reference Properties dialog. Set the Output cell size to 25000 (25 km).
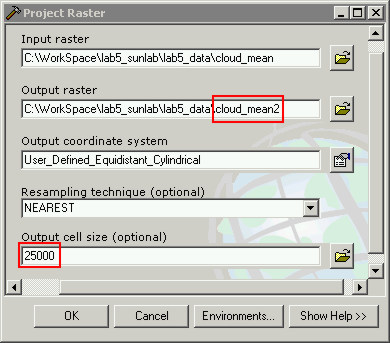
If you have entered all the fields correctly, the Project Raster dialog should now look like the screenshot below. Click OK when you have verified that the fields are correct.
The projected grid (cloud_mean2) should now show up in ArcCatalog. Repeat this procedure for the other three grids (cloud_med, elevation, pop2015).
Right-click in the white area in the right side of the ArcCatalog window below where the files are listed, and do New -> Personal Geodatabase, name it "SunlabGeodb".
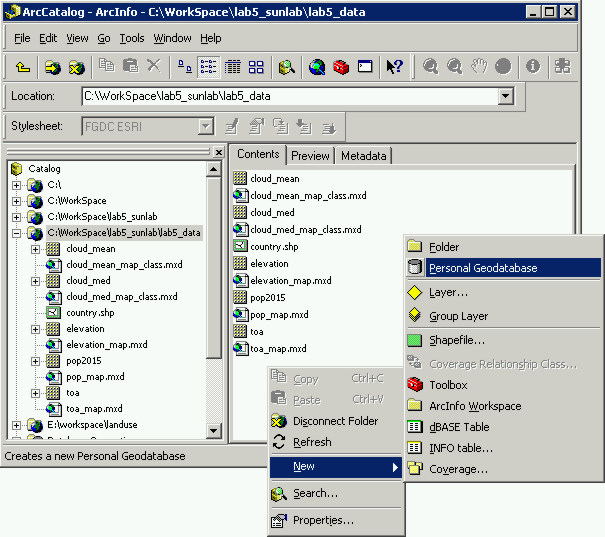
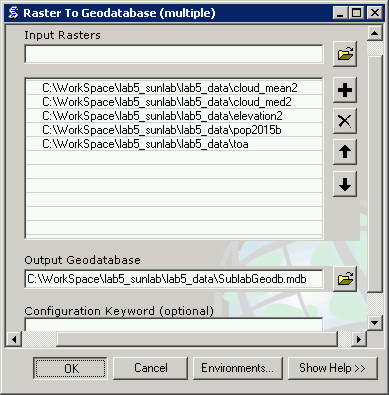
Import all the projected grids (including correct toa grid) into SunlabGeodb.mdb. In ArcCatalog right-click on the geodatabase and go to Import -> Raster Datasets...
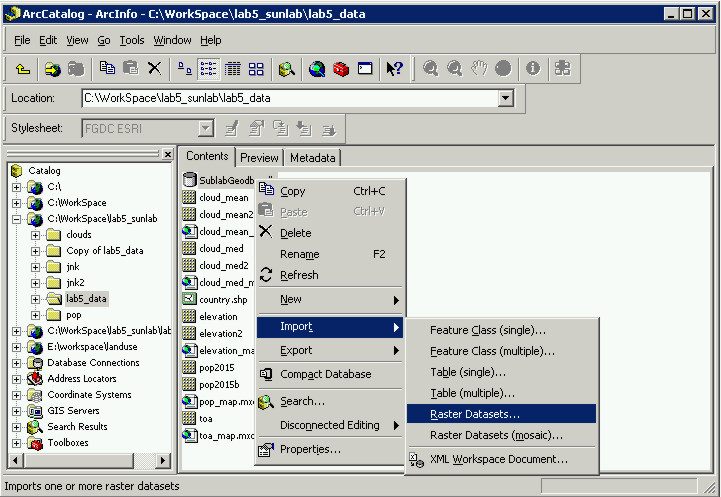
In the Raster to Geodatabase dialog that opens click the folder button next to the Input Raster field, and select all the projected grids, then click OK (see below).
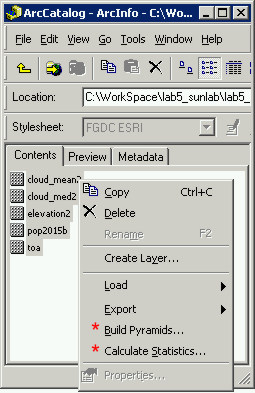
Step 2.1 - Build Pyramid layers and Calculate Statistics for the grids in the Geodatabase
After you've imported all the grids into the geodatabase, open the geodatabase in ArcCatalog. Right-click on all the grids (there should be 5 of them) and choose Build Pyramids, it may take a while to load the Batch Build Pyramid dialog. When it does just click OK. Then do the same thing again and choose Calculate Statistics.
You have just created a Geodatabase that contains all of your final grids. Close ArcCatalog (and close ArcMap if you have it open).
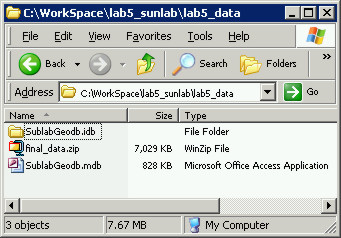
With Windows Explorer go to C:\WorkSpace\lab5_sunlab\lab5_data and look at the folder's contents. There is a folder called SunlabGeodb.db and a file called SunlabGeodb.mdb. The geodatabase file and the folder are all you need now.
If you are done generating all of your final maps for TOA, Cloudiness (mean and median), Elevation and Gridded Population, you can now WinZip all of the contents of lab5_data accept the geodatabase file (and folder). The final master data folder looks like the following screenshot, all the grids have identical projections and are all referenced in the geodatabase file.
Step 3 - Add the data layers to ArcMap
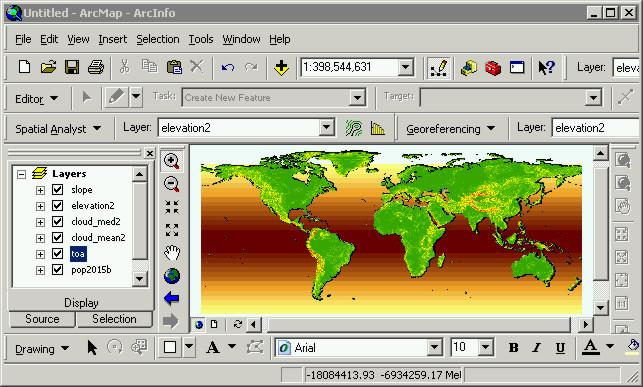
Open ArcMap with an empty layout, add all the grids from the Geodatabase. All of the grids should now show up without any warning messages about coordinates and it should automatically set the Map units and Display units to meters. DO NOT worry about symbolization, we're only using these data to generate outputs.
* If for some reason ArcMap is being fussy and not loading the grids from the geodatabase you need to close ArcMap, start ArcCatalog again and do Build Pyramid layers and Calculate Statistics. Sometimes geodatabases looks track of grid statistics files (but hopefully yours will not).
For the purpose of determining which pixels are suitable for solar power facilities we are going to consider elevation. Lets also consider slope as one of the layers. To make a slope grid go to Spatial Analyst -> Surface Analysis -> Slope ...
In the Slope dialog set the Input surface to elevation, make the Output measurement in Percent, and name the Output raster "slope".
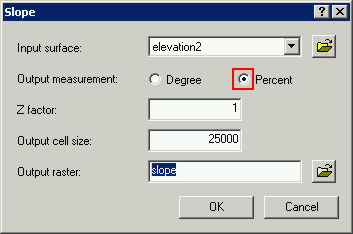
The slope grid will be automatically added to ArcMap.
You can set the projection by first checking that the View -> Data Frame Properties coordinate system is set, and then do Data -> Export Data (and use Current as the Spatial Reference) or you can just go from here and deal with ArcMap barking at you about coordinate system problems. If you do do Data -> Export data, export it to your geodatabase, remove the old slope grid.
Step 3.2 - Make some map algebra expressions to map areas suitable for solar power facilities.
Start Raster Calculator, and enter an expression that will test all 5 layers for a set of parameters. I would suggest you start Notepad, or Word, and copy-paste the expressions you make in Raster Calculator into a empty document (of text file) so you can keep track of what you do. Record the exact parameters and the name of the grids you generate. You will probably make a few in your search for the idea set of parameters so keep track of the parameters that you use each time (type them out in the document, then copy-paste them into Raster Calculator).
If you encounter problems and Raster calculator starts being stubborn, close ArcMap zap all the files/folders in the Windows temp folder. C:\Documents and Settings\user\Local Settings\Temp
I have used two shapefiles (Cntry00.shp and continent.e00) from the ArcGIS map layouts data folder which can be found here: C:\program files\arcgis\bin\templatedata\world\
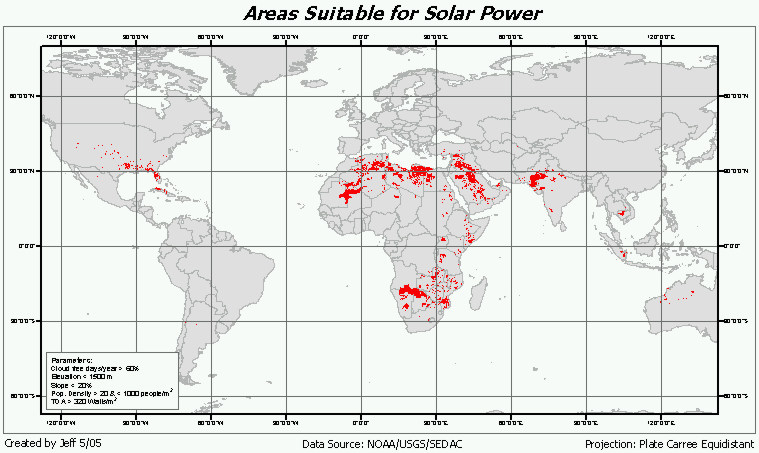
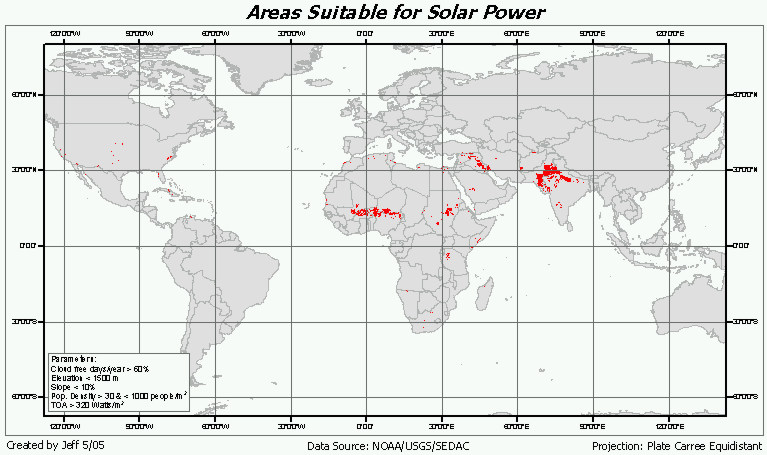
I have made two maps for demonstration. You are by no means constrained to use the values I have at all. You've worked to generate these data, and you have no doubt thought about this a little bit.
You can copy-paste this into Word, type in the values and then copy-paste it into your maps.
Cloud free days/year > __%
Elevation < ____ (m)
Slope < __%
Population Density > __ and < ____ (people/km2)
TOA > ___ W/m2
sunmap1 = (([cloud_med2] > 60) & ([elevation2] < 1500) & ([pop2015b] > 20) & ([pop2015b] < 1000) & ([slope] < .25) & ([toa] > 320))
sunmap2 = (([cloud_mean2] > 60) & ([elevation2] < 1500) & ([pop2015b] > 30) & ([pop2015b] < 1000) & ([slope] < .10) & ([toa] > 320))
Your final project for Lab 5 (parts 5.1-5.4) will be a webpage describing each of the data layers in the most general terms. Include a webpage of "results" where you present the final maps you make in this lab (you are not constrained to only two outputs either). Please include the parameters you used for each of the maps in plain words. Also, discuss some of the limitations of this analysis, and possible ways to improve it.
For web design we're limited to Microsoft Office. Make a PowerPoint Presentation, if you arrange everything as PowerPoint slides and then do Save As, and choose html as file option it will make a webpage out of the PowerPoint file. Make yourself a folder on the network drive, and I will put everything online. If you have access to a computer that has Mozilla (Composer) or Macromedia Dreamweaver feel free to use that, these two programs make way better html than Office but that is what we have to work with.