
Author:
Richard L. Synder
Biometeorologist
University of California, Davis
Drought Tip 92-41 is a publication series developed as a cooperative effort by the following organizations:
California Department of Water Resources - Water Conservation Office
Department of Land, Air and Water Resources University of California
USDA Drought Response Office
USDA Soil Conservation Service If you have comments or suggestions, please email lawrweb@ucdavis.edu.
Last reviewed December 19, 2002
Drought Tip 92-41
Irrigation Scheduling for Low-Volume (Drip of Microsprinkler) Systems
Knowing when to irrigate a crop and how much water to apply is crucial during a drought. Irrigation timing depends on the irrigation method, soil water intake characteristics, and the difference between the soil water content at field capacity (when the soil is full of water) and the measured or estimated (actual) soil water content.
The difference between field capacity and the actual soil water content is called the “soil water depletion.” When to irrigate and how much water to apply is determined by monitoring or estimating the soil water depletion and applying water when the depletion reaches a pre-selected level — called the management allowable depletion (MAD).
The management allowable depletion must be set at a level that will prevent yield-reducing water stress and also be compatible with the low-volume system constraints.
The first step is to determine the gross application amount for the longest acceptable set time — usually 24 hours. For example, using a 24-hour set and an application rate of 10 gallons per minute per acre (0.022 inches per hour), the gross application amount is:
- Gross application = 0.022 inches per hour x 24 hours = 0.53 inches
The net application is determined as follows:
- Net application = gross application x system application efficiency (expressed as a fraction)
(If the soil water depletion has been determined accurately, distribution uniformity measurements from a system evaluation will provide an estimate of application efficiency.)
Application efficiencies in the range of 80 to 85 percent are attainable for orchard drip, and application efficiencies of 75 to 85 percent are attainable for row crop drip systems. Local farm advisors can provide information on performing a system evaluation.
The net application, calculated with Equation 2, is used as the management allowable depletion (MAD) for irrigation scheduling unless yield-reducing water stress occurs before the actual soil water depletion reaches MAD. If that happens, the MAD must be reduced.
If the gross application is 0.53 inches and the application efficiency is 0.80, the net application and the management allowable depletion both equal 0.42 inches. Irrigations are therefore needed on the day before the date actual soil water depletion is expected to exceed 0.42 inches. The irrigation system cannot refill the depleted soil water in 24 hours if the soil water depletion exceeds 0.42 inches.
Estimating Soil Water Depletion
Water loss from a well-managed irrigated crop occurs mainly through crop evapotranspiration (ETc). Losses also occur during the irrigation process, but these can be minimized if the water is applied uniformly.
While irrigation is the main water source for California crops, rainfall, fog, and groundwater tables can also supply some crop water needs. Soil water depletion levels should therefore be updated daily by adding ETc and subtracting the water supplied by irrigation, rainfall, fog, or groundwater. The soil water depletion can never be less than zero, and the goal of each irrigation is to return the depletion to zero.
Crop Evapotranspiration
Crop evapotranspiration (ETc) is calculated by multiplying reference evapotranspiration (ETo) by a crop coefficient (Kc):
- ETc = ETo x Kc
Average ETo by zones of similar evaporative demand are given in leaflet 92-54 in this Drought Tips series. Crop coefficients and ETc values by evaporative demand zone for specific crops grown in California are given in Drought Tips 92-44, 92-45, 92-46, 92-47, and 92-48.
Rainfall and Fog
Since rainfall contributes to crop water needs, soil water depletion estimates must be adjusted during rainy weather. Any rainfall that coats the plants or is stored in the root zone where the crop can use it for evapotranspiration is “effective rainfall.” Precipitation that causes the soil to exceed the soil water depletion before the rainfall will pass below the root zone and is not effective rainfall. Water that flows off the field as surface runoff is also not effective rainfall. Most rainfall that fills the soil up to the preceding soil water depletion is effective unless the rainfall is heavy, the field has a steep slope, or the soil has a slow intake rate.
During foggy periods, contributions to ETc by intercepted fog reduce soil water losses. When fog is intercepted, cumulative ETc over-estimates actual soil water depletion. A correction for fog interception can be made by noting the time fog dries off the crop and estimating the contribution as a fraction of daily ETc. See Drought Tip 92-40 for guidelines on how to correct for fog interception.
Irrigation Scheduling
Daily ETc rates are used for scheduling irrigations in low-volume irrigation systems. The set time (ST) for an irrigation is calculated as follows:
- ST = (AD ÷ AE)/ AR
where AD is the actual soil water depletion in inches since the last irrigation, AE is the application efficiency, expressed as a fraction, and AR is the application rate in inches per hour. The actual depletion (AD) is calculated as the cumulative ETc minus effective rainfall, fog interception, and groundwater contributions since the last irrigation.
The distribution uniformity of the system provides an estimate of application efficiency if the soil water depletion is accurately determined and Equation 4 is used to estimate ST.
The application rate in inches per hour can be determined from the pump flow rate in gallons per minute (GPM) and the number of acres being irrigated:
- AR = GPM per acre/ 450
Where salinity levels are high, the value of AD in Equation 4 should be increased slightly before the set time is calculated to provide for salt leaching in parts of the field receiving the least water. Local farm advisors can provide information on the leaching requirement (extra water) needed to control salt accumulation.
As a scheduling example, consider a low-volume system (AR = 0.022 inches per hour) used to irrigate citrus grown in the South Coast Interior Valley regions of California.
The daily mean ETo data for citrus in the region are plotted in Figure 1 to determine the irrigation frequency for this low-volume system. Irrigation frequencies are separated by horizontal lines and the appropriate frequencies are indicated in days.
Using a MAD of 0.42 inches, the graph shows that an irrigation is needed before the cumulative ETc since the last irrigation date exceeds 0.42 inches. If the mean daily ETc rate exceeds 0.21 inches (0.42 divided by 2), daily applications (one-day frequency) are needed. Similarly, if the mean daily ETc rate exceeds 0.14 inches (0.42 divided by 3), applications are needed every other day (two-day frequency). A three-day frequency is needed when mean daily ETc exceeds 0.105 inches (0.42 divided by 4), and so on.
A graph similar to Figure 1 can be plotted to schedule irrigation frequency using local ETc information and the management allowable depletion for the low-volume system being used.
The actual amount of water to be applied varies according to the ETc accumulated since the last irrigation. If the daily ETc rate is 0.12 inches, a three-day irrigation frequency is appropriate (from Figure 1). The three-day net application should be 0.36 inches (0.12 times 3) and the gross application amount for a system with an AE of 80 percent is 0.45 inches (0.36 divided by 0.80). If the application rate is 0.22, the set time for applying 0.45 inches is 20.5 hours (0.45 divided by 0.022). Therefore, to replace the soil water depletion, the citrus should be irrigated every third day for 20.5 hours.
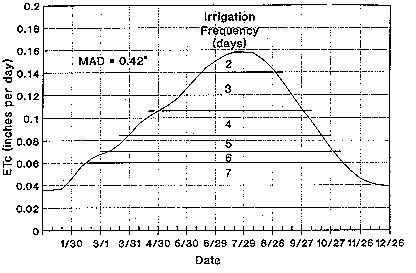
Figure 1. Daily critrus ETc rates for south coast interior valleys and irrigation frequencies for low-volume irrigated citrus using a MAD or 0.42 inches.
Deficit Irrigation
Some drought-tolerant crops can be deficit-irrigated — given reduced amounts of water — with little loss in yield or quality if stress is avoided during critical periods. Excess water is usually applied to a crop to compensate for non-uniformity in the irrigation application. When these excess amounts are reduced, a smaller percentage of the field is refilled to field capacity at each irrigation.
Those parts of the field having deficit soil water contents may experience water stress, lower ETc, and reduced yield, but some crops, such as cotton, canning tomatoes, and sugar beets, produce a more marketable product when they undergo moderate stress from deficit irrigation. Stress-sensitive crops, of course, should not be deficit-irrigated.
References
Bowers, W.O., R.L. Snyder, S.B. Southard, and B.J. Lanini. 1989. Water-holding characteristics of California soils. University of California Leaflet 21463.
Faber, B. and R.L. Snyder. 1992. "South coast valleys evapotranspiration and crop coefficients for field crops." University of California Drought Tip 92-48.
Schulbach, K. and R.L. Snyder. 1992. "Central coast valleys evapotranspiration and crop coefficients for field crops." University of California Drought Tip 92-45.
Snyder, R.L. 1992. "Fog contributions to plant water needs." University of California Drought Tip 92-40.
Snyder, R.L. and K. Bali. 1992. "North coast valleys evapotranspiration and crop coefficients for field crops." University of California Drought Tip 92-44.
_______________. 1992. "Sacramento Valley evapotranspiration and crop coefficients for field crops." University of California Drought Tip 92-46.
______________. 1992. "San Joaquin Valley evapotranspiration and crop coefficients for field crops." University of California Drought Tip 92-47.
Snyder, R.L. 1992." Reference evapotranspiration (ETo) averages for California." University of California Drought Tip 92-54.